| Written by Constance Stickler
Table of contents:
- Supply Chain Optimisation Starts with Visibility
- Why Does the Container Terminal Matter to Supply Chain Optimisation?
- Is a Good KPI Enough?
- Can Technology Help Close the Gap Between Measurement and Optimisation?
- From KPI Reporting to Continuous Optimisation
- FAQ
- Takeaway
- Glossary
Supply Chain Optimisation Starts with Visibility
Optimising the supply chain for efficiency can be summarised in two goals: transporting goods faster and reducing costs. However, as soon as one starts to implement the task, its complexity becomes apparent: container flows cross organisational and operational boundaries, and a delay at one point in the chain can quickly have consequences elsewhere.
And then there's another problem: Optimisation depends on the underlying assumptions. A recent article by Loadstar sums this up perfectly: “The biggest risk is not making the wrong calculation. It is asking the wrong questions.” (1)
The same applies to resilience. Ideally, it is built before disruptions occur, not when a supply chain is already under pressure. However, given geopolitical tensions, changing trade patterns, congestion, climate change and other disruptions already impacting global supply chains, there is little room to wait for a calmer moment. Resilience must be built in response to disruptions – and that makes visibility all the more important.
Why Does the Container Terminal Matter to Supply Chain Optimisation?
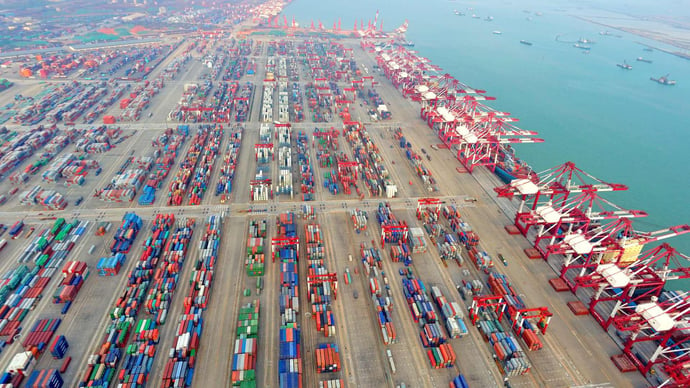
Container terminals are the central hubs of supply chains. Various modes of transport converge there. Large container ships, as well as smaller feeder vessels, trucks, trains, and inland barges, each have their own schedules and deadlines. The capacity of the facilities on the terminal site is limited. The terminal must coordinate all these processes, often while handling thousands of containers and dozens of competing priorities.
If this coordination goes well, the flow of containers will be smooth. If it is delayed, the consequences will spread rapidly.
That's precisely why visibility is so essential. A terminal typically knows how many containers it has handled, how long trucks had to wait, or how productive its dock cranes were. Yet, these figures don't necessarily explain what's happening with the flow of goods.
A terminal can have a wealth of data and still lack visibility. The difference is crucial. Data shows what happened. Visibility helps to understand what happened, when it happened, and how one event impacted another.
Let's take container handling as an example. The terminal operating system (TOS) displays the planned job and its completion. But what happened in between? Did the assigned vehicle have to wait for the job? Was the container at the designated location? Was the equipment temporarily en route empty? Was other equipment unavailable? Did the handling take longer than planned?
Many actors and processes converge at the port, like pieces of a puzzle. This puzzle must be viewed as a whole to properly identify and resolve problems.
Let's take the dwell time in storage. A high average value can indicate congestion, customs delays, documentation issues, the recipient's behaviour, or insufficient inland transport capacity. The terminal cannot necessarily solve all of these problems. However, it must know where its own processes contribute to the delays and where the problem lies outside its control.
The goal is not simply to measure results. It's about understanding the events that lead to these results – and recognising when reality deviates from the plan.
What Should a Terminal Director Measure?
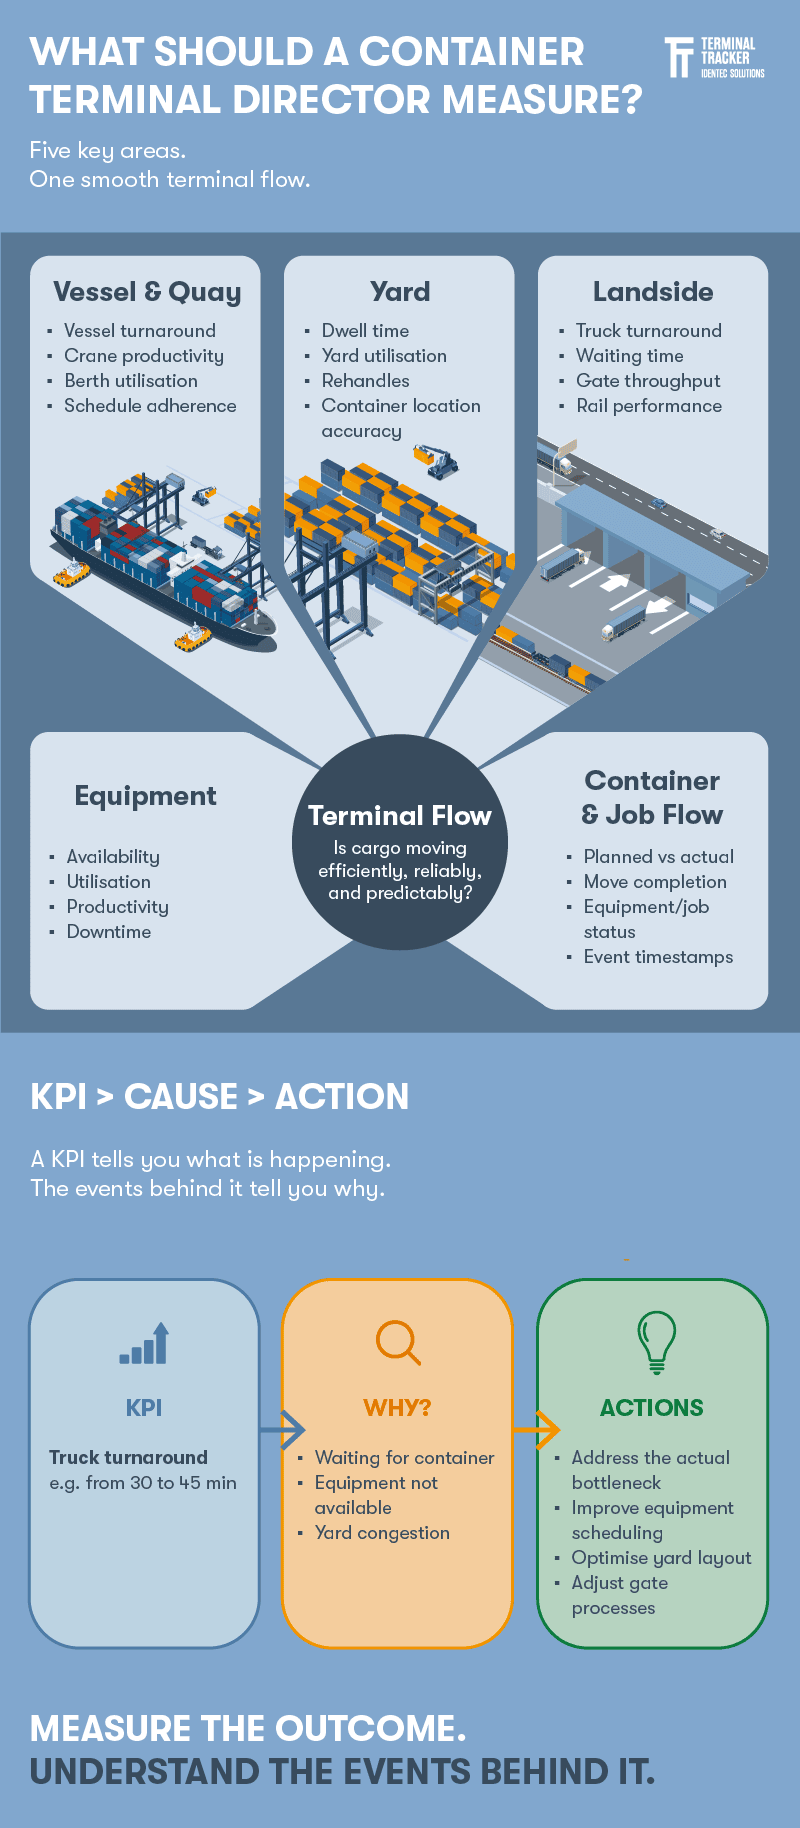
When selecting KPIs, the crucial factor is whether the chosen metrics provide insight into the reliability and efficiency of cargo flow through the terminal.
Three questions offer a useful starting point for this:
1. Are we moving cargo efficiently?
- What are we trying to improve?
- Where is the bottleneck?
- Are we measuring the outcome that matters?
2. Are we moving cargo reliably and predictably?
- Are we meeting plans and commitments consistently?
- Where do deviations occur?
- Are we measuring variability, not just averages?
3. Can we explain why performance changes?
- What events caused the result?
- Do we have reliable data to identify them?
- Can someone act on what we discover?
This requires looking beyond mere throughput. A meaningful measurement system should cover the key areas where terminal performance impacts operations: vessel and quay operations, yard performance, landside processing, technical equipment, and the accuracy of container movements (see also: Container yard operations).
However, a distinction must be made between outcomes and the underlying events: a truck’s turnaround time, for instance, reveals whether the overall process was fast or slow. Yet, it does not indicate whether the truck had to wait for a container, whether the container was in the expected location, or whether the necessary equipment was unavailable.
For a terminal director, the goal is therefore to establish a measurement system that reveals what happened, why it happened, and where interventions can improve operations. The decisive factor is which metric helps in making a better decision.
Is a Good KPI Enough?
Here is an uncomfortable truth about KPIs: even a very good KPI can reveal little on its own.
Take truck turnaround time. Suppose the terminal reports an average of 47 minutes. The target is 50 minutes. That sounds like good news. But is it really? What if 80% of trucks depart within 30 minutes, while the remaining 20% have to wait two hours? What if these long wait times occur every afternoon? What if they all happen in the same area of the container yard? And what if the root cause isn't insufficient truck capacity, but rather containers arriving at the wrong time or equipment waiting for instructions?
Averages obscure the real story; this is one of the pitfalls of terminal performance management. Numbers appear objective. They convey a sense of security. A dashboard full of green indicators can create the impression that operations are under control.
A KPI is a signal. It is not a diagnosis. Understanding this is crucial when optimising complex operations. You need to know not only whether performance met the target, but also what led to that result.
Can Technology Help Close the Gap Between Measurement and Optimisation?
Yes, it can—by bridging the gap between measurement and optimisation and linking terminal planning with actual on-site operations.
The Terminal Operating System (TOS) serves as the starting point. It manages orders, container movements, vessel handling, and planned slot allocations. However, it cannot always capture what happens between individual transactions. This is where additional technologies provide the missing operational details:
Positioning Detection Systems (PDS), RFID (Radio Frequency Identification), and IoT (Internet of Things) can provide information about the location and movement of assets and operational events. On-board computers and vehicle telematics supplement this data with details on machine status, operating hours, error messages, and other equipment information. Taken together, these technologies enable a much more precise picture of physical operations.
These insights can be directly integrated into operational workflows. For example, if the system knows which truck is available and where, jobs can be prioritised and assigned to the most suitable vehicle. Equipment position data helps confirm whether a job has arrived at the correct location and whether a transport actually took place.
Technology also supports safety and equipment management. Collision warning systems can alert operators to potential hazards. Geofencing, barriers, and displays help manage vehicle traffic. Sensors detect vibrations or monitor tyre pressure and temperature. Machine data reveals errors or maintenance needs before major problems arise.
At the container level, automated processes for identification, weighing, and twist-lock control link physical handling more closely with the TOS and reduce the risk of manual errors.
The value of these technologies lies in the integration of physical operations, digital plans, and operational decisions.
The shift is therefore not merely from manual to automated data capture; it represents a move from retrospective measurement to real-time operational visibility—and from that visibility to targeted actions.
From KPI Reporting to Continuous Optimisation
While a KPI dashboard is useful, it essentially reflects the past. It informs the terminal director about what has already happened; continuous optimisation, by contrast, focuses on what should happen next.
This requires a different operational workflow: performance is measured, deviations from target outcomes are identified, their root causes are investigated, and appropriate measures are taken. Subsequently, the result is reviewed to determine whether the change actually led to a performance improvement.
This is precisely where exceptions become significant. An average value might indicate an acceptable truck turnaround time, yet recurring delays at specific times, locations, or process steps could signal an emerging bottleneck.
Technology can accelerate this process by automatically detecting deviations and providing the operational context needed to investigate them.
The goal is not to optimise each KPI in isolation. Improving one process at the expense of another would merely shift the problem elsewhere. Continuous optimisation means constantly improving the flow of containers throughout the entire terminal (see also: Terminal automation and what to look for).
FAQs
Who Should Own Supply Chain Optimisation at the Terminal?
Supply chain optimisation is neither purely an IT project nor something confined solely to the operational sphere. The most promising approach is to assign clear responsibility to a single executive while simultaneously involving teams from operations, IT, engineering, planning, and customer-facing teams. The terminal director or COO is often the best choice to sponsor the program, as optimisation decisions can impact the entire operation.
IT is tasked with interconnecting systems, improving data availability, and providing the digital infrastructure needed to measure performance. Operational teams contribute practical expertise: they understand what actually happens on the ground and where processes tend to stall. It is crucial to avoid creating an isolated "island of optimisation" and to ensure the focus remains not primarily on implementing technology, but on improving workflows and business outcomes.
Takeaway
Optimising the supply chain begins with understanding how freight actually moves through the terminal. The crucial questions are simple: Are we moving freight efficiently? Is this process reliable and predictable? Can we explain why performance fluctuates?
Historical performance data alone is insufficient to answer these questions. Terminals require reliable operational data, technologies to capture on-site activities, and processes to translate this information into concrete actions.
For terminal directors, this entails a shift from mere performance measurement to active performance management: identifying deviations, understanding their root causes, taking appropriate action, and measuring the results. In a supply chain where disruptions can occur at any time, the ability to detect and respond to developments is arguably just as important as efficiency itself.
Delve deeper into one of our core topics: Port Automation
Glossary
A dock crane is a heavy-duty lifting machine installed at a port quay or dock to load and unload cargo between ships and the shore. It may be fixed or mobile and can handle containers, bulk goods, breakbulk, or project cargo using hooks, grabs, spreaders, or other attachments. Dock cranes improve turnaround time by moving large weights quickly and precisely, and they are essential equipment for modern terminals. (2)
Geopolitical tensions that affect logistics are political, military, or economic conflicts between states or regions that disrupt trade routes, border crossings, and supply networks. They can trigger sanctions, export controls, port closures, rerouting around conflict zones, higher insurance and fuel costs, and delays at customs. Logistics managers must adjust sourcing, transport modes, and inventory policies to maintain service while managing risk. Examples include wars affecting key sea lanes, trade wars, and sanctions that fragment global supply chains. (3)
Sources:
(2) House, David (2020): Cargo Work: For Maritime Operations. Elsevier.
(3) Kania, Aleksandra (2026): Resilient Global Supply Chains and Geopolitical Risk: Evidence from Central and Eastern Europe. Routledge.
Note: This article was partly created with the assistance of artificial intelligence to support drafting.

Author
Conny Stickler, Marketing Manager Logistics
Constance Stickler holds a master's degree in political science, German language and history. She spent most of her professional career as a project and marketing manager in different industries. Her passion is usability, and she's captivated by the potential of today's digital tools. They seem to unlock endless possibilities, each one more intriguing than the last. Constance writes about automation, sustainability and safety in maritime logistics.